


This easy-to-use guide includes information, tips and videos showing:
- how to use our products
- how to choose the best product for your application and laser source
What are the differences between our products?
All our products are based on the dispersion scan technique. Each product measures the SHG spectrum of your laser as a function of dispersion and retrieves the spectral phase of the laser pulse. The main differences between products are the type of measurement (scanning or single-shot), the shortest/longest pulse that can be measured, and if the system can also simultaneously compress the pulse. The table below summarizes the main differences between our three product families for laser applications.
| measures | measures and compresses | single shot | 2.5fs to 10fs | 2.5fs to 60fs | 10fs to 50fs | 60fs to 200fs | |
| d-scan | X | X | X | X | |||
| d-cycle | X | X | X | X | |||
| d-shot | X | X | X |
For microscopy applications, we specifically designed the d-micro, which allows to compensate the microscope dispersion, ensuring a compressed laser pulse on the sample plane of the microscope.
d-scan
THE ULTIMATE MEASUREMENT AND CONTROL TOOL FOR ULTRAFAST LASER OSCILLATORS AND HOLLOW-FIBER COMPRESSORS
d-scan is an inline, compact and high-performance device for the simultaneous measurement and compression of even the most demanding ultrafast pulses.
d-scan handles broadband oscillators, amplifiers, OPAs and hollow-fiber compressors. Coupling your beam into the d-scan is easily achieved in less than one minute and a full measurement takes less than 10 seconds.
d-scan traces are very intuitive and a proprietary algorithm provides accurate retrieval of the full electric field of the pulses, including its exact duration.
How to align a d-scan
Take a look at the video, you will see how simple, fast and straight forward is to align the d-scan and take a measurement!
Measurement examples
Oscillator
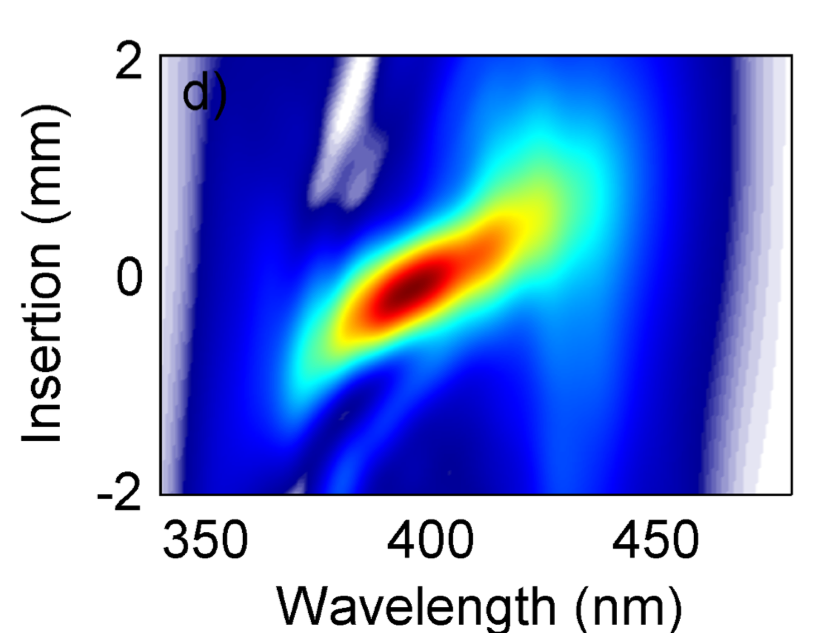
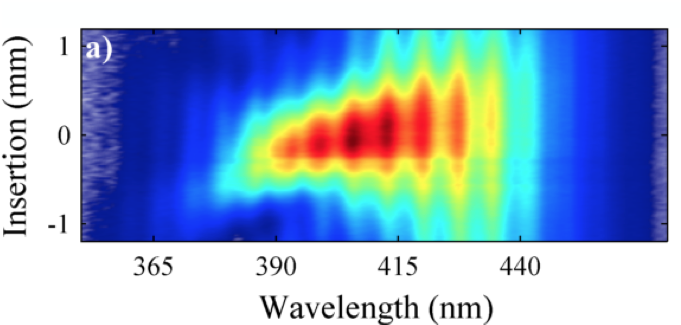
Few-cycle Ti:Sapphire oscillator: Measured (a) and retrieved (b) d-scan traces. (c) Measured spectrum (black) and retrieved spectral phase (red). (d) Retrieved temporal profile (black) and phase (red). Pulse duration is 5.5 ± 0.1 fs (FWHM).
For more details please check:
M. Miranda, P. Rudawski, C. Guo, F. Silva, C. Arnold, T. Binhammer, H. Crespo, and A. L’Huillier, “Ultrashort laser pulse characterization from dispersion scans: a comparison with SPIDER,” in CLEO: 2013, OSA Technical Digest (online) (Optical Society of America, 2013), paper JTh2A.31 (San Jose, CA, USA, 9-14 June 2013).
Hollow Fiber Compressor
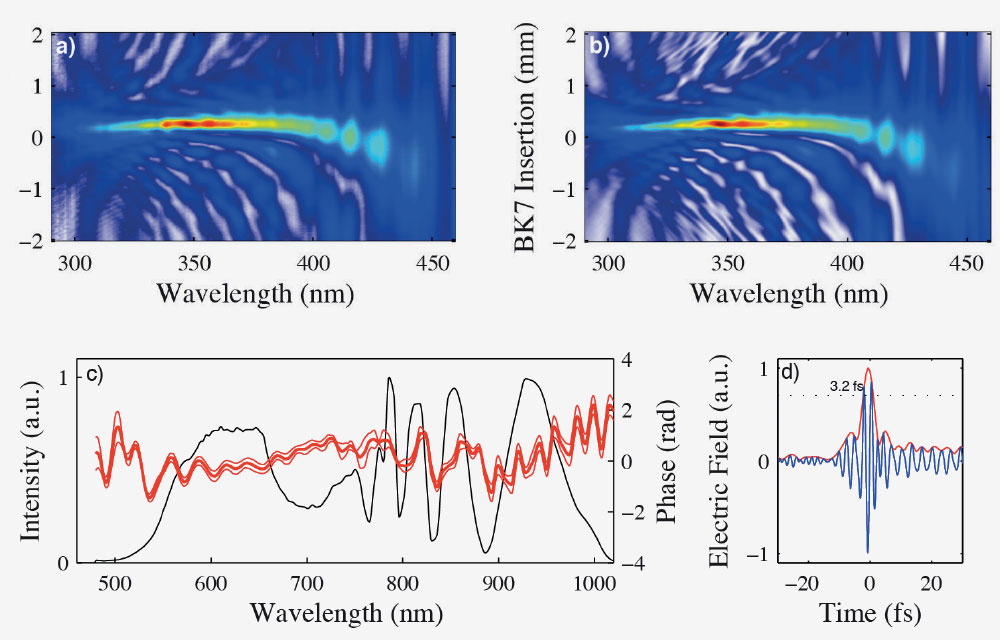
Single-cycle hollow-fiber compressor: Measured (a) and retrieved (b) d-scan traces. (c) Measured spectrum (black) and retrieved spectral phase with standard deviation (red). (d) Retrieved temporal profile for the wedge insertion that minimizes the pulse duration, corresponding to 3.2 fs (1.3 cycles at 740 nm).
For more details please check:
F. Silva, M. Miranda, B. Alonso, J. Rauschenberger, V. Pervak, and H. Crespo, “Simultaneous compression, characterization and phase stabilization of GW-level 1.4 cycle VIS-NIR femtosecond pulses using a single dispersion-scan setup,” Opt. Express 22, 10181-10191 (2014)
Brochures
Please feel free to download our brochures
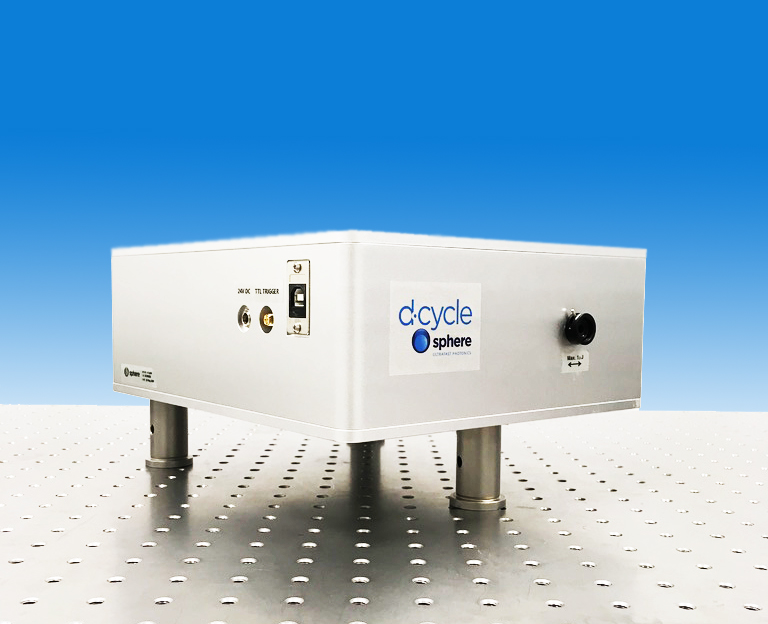
d-cycle
THE ULTIMATE MEASUREMENT TOOL FOR ULTRAFAST LASER OSCILLATORS AND HOLLOW-FIBER COMPRESSORS
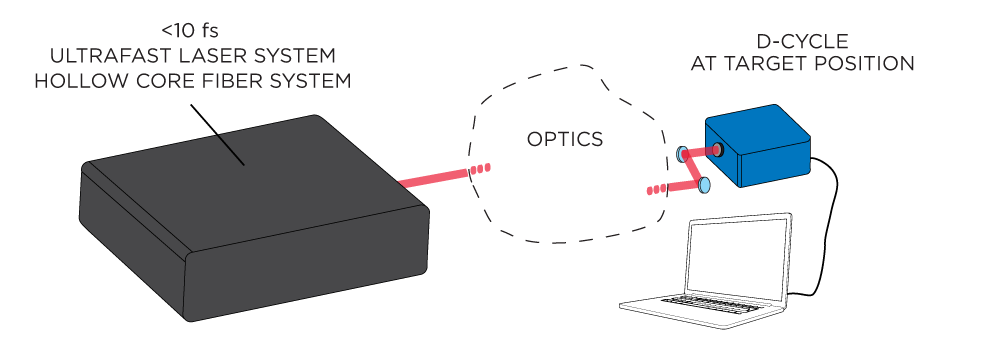
d-cycle is an inline, compact and high-performance device for the measurement of even the most demanding ultrafast pulses.
d-cycle handles broadband oscillators, amplifiers, OPAs and hollow-fiber compressors.
Coupling your beam into the d-cycle is easily achieved in less than one minute and a full measurement takes less than 10 sec.
d-cycle traces are very intuitive and a proprietary algorithm provides accurate retrieval of the full electric field of the pulses.
How to align a d-cycle
Take a look at the video, you will see how simple, fast and straight forward is to align the d-cycle and take a measurement!
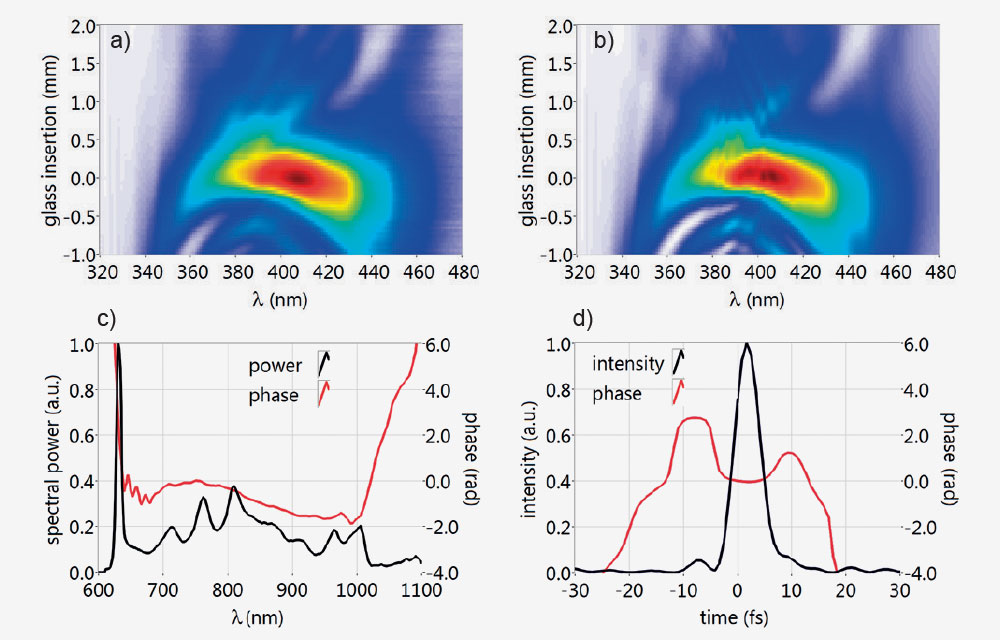
Measurement examples
These measurements have been taken on an Hollow-core fiber compressor, delivering few-cycle pulses of 3.0 fs!
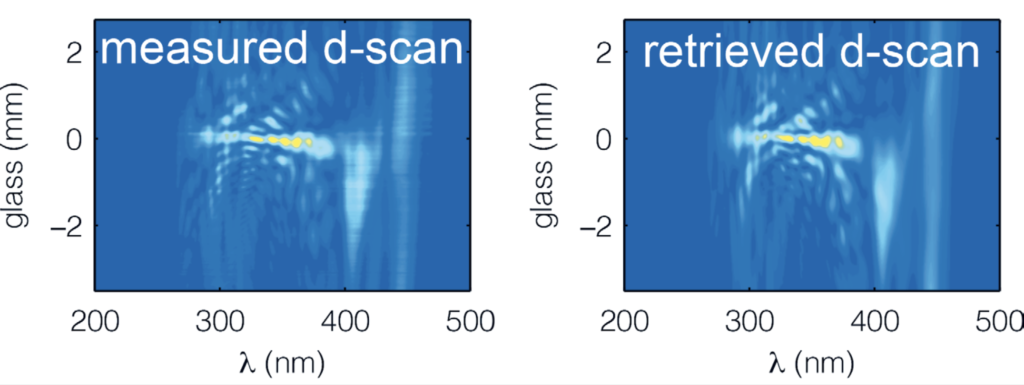
Measured and retrieved d-scan traces.
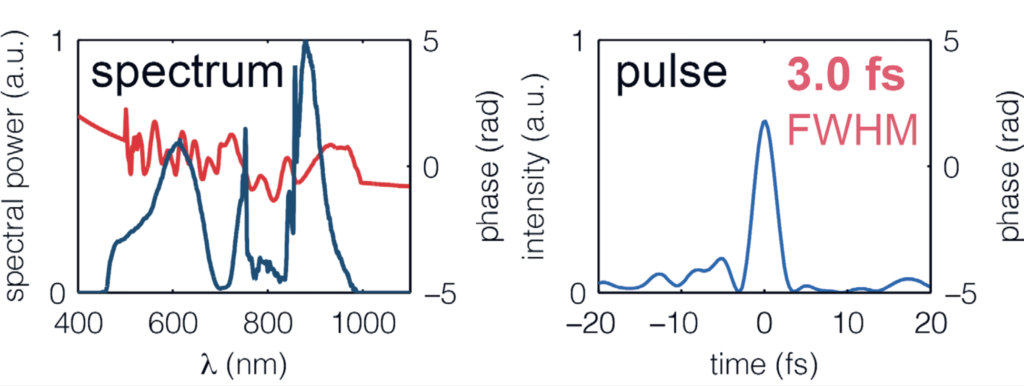
(Left) Measured spectrum (black) and retrieved spectral phase (red).
(Right) Retrieved temporal profile of the compressed 3.0 fs pulses.
Brochures
Please feel free to download our brochures
d-shot
THE ULTIMATE SINGLE SHOT MEASUREMENT TOOL FOR ULTRAFAST LASER OSCILLATORS AND HOLLOW-FIBER COMPRESSORS
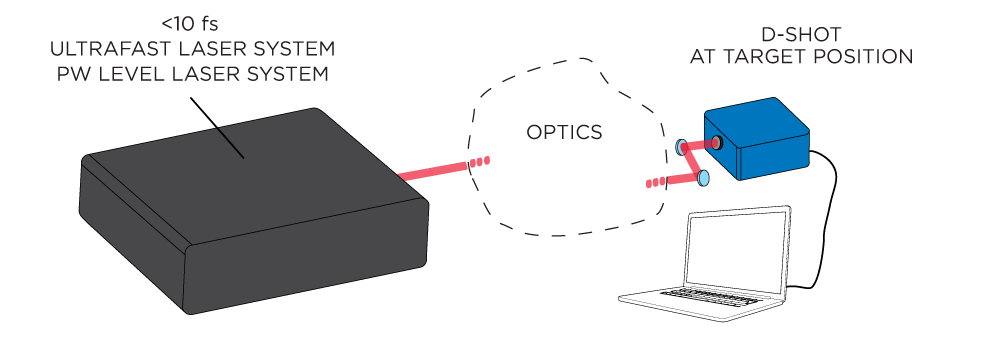
d-shot is an inline, compact and high-performance device for the single shot measurement of even the most powerful ultra- fast laser pulses.
d-shot handles broadband oscillators, amplifiers, OPAs and up to PW level laser systems.
Coupling your beam into the d-shot is easily achieved in less than one minute and a full measurement takes less than 10 sec.
d-shot traces are very intuitive and a proprietary algorithm pro- vides accurate retrieval of the full electric field of the pulses.
How to align a d-shot
Take a look at the video, you will see how simple, fast and straight forward is to align the d-scan and take a measurement!
Measurement examples

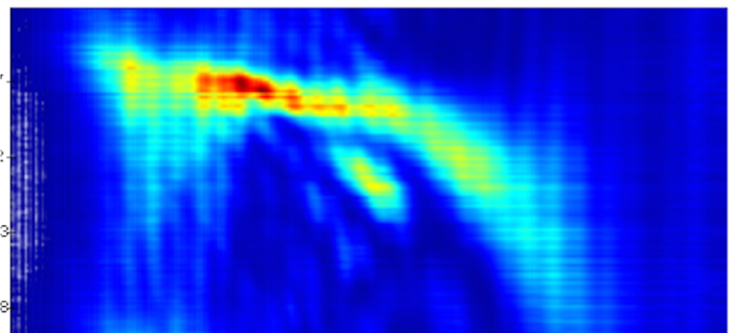
(top) Measured and retrieved d-shot traces. The good match between the Measured and Retrieved
traces is an indicator of the quality of the measurement.
(bottom left) Measured spectrum (red) and retrieved spectral phase (blue).
(bottom right) Retrieved temporal profile of the compressed 37 fs pulses.
Brochures
Please feel free to download our brochures
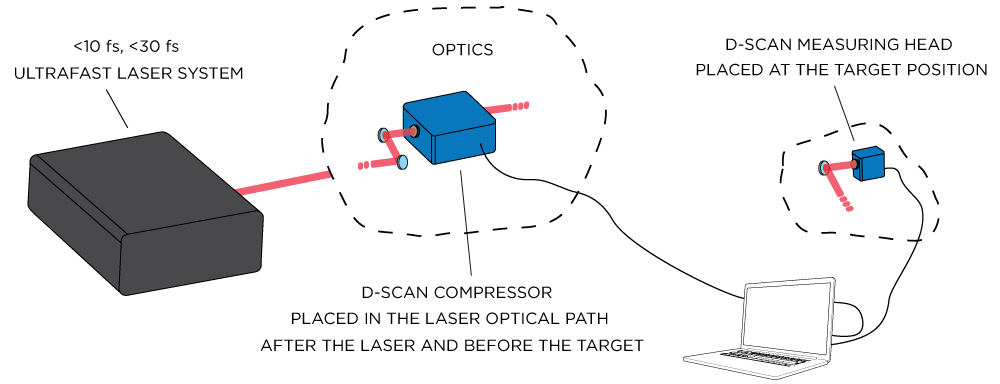
d-micro
Image quality in multi-photon microscopy depends drastically on the compression of the laser pulses at the sample. Every optical component in a microscope introduces temporal dispersion that increases the laser pulse duration.
Ensuring optimum pulse compression at the sample is not an easy task, and is harder to do for shorter pulses. Sphere’s d-micro was especially developed to solve this problem by simultaneously compressing the pulse and ensuring optimum duration directly at the sample plane, even for the most demanding laser pulses.
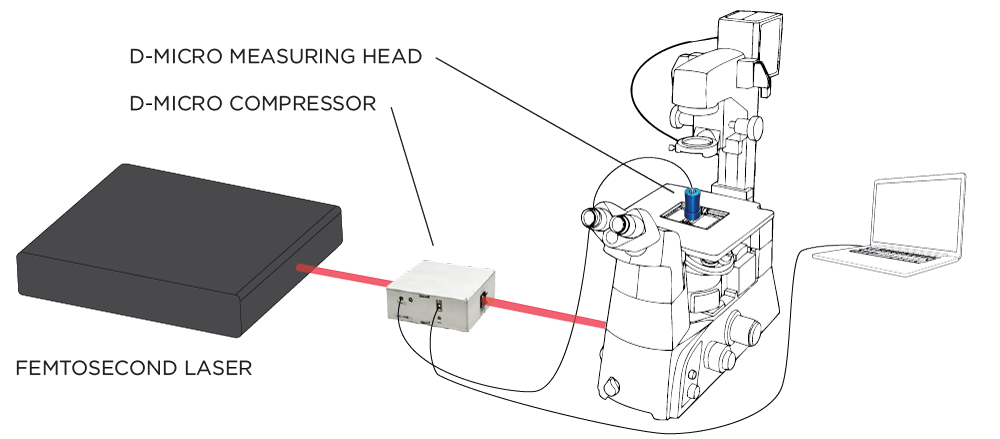
The d-micro comprises two COMPACT modules:
– the COMPRESSOR, which allows pre-compensating the dispersion introduced by the microscope – the MEASURING HEAD, which measures the pulse directly at the sample position.
Sphere Ultrafast Photonics can install the d-micro system on a microscope already equipped with a femtosecond laser, or can provide a complete ultra-broadband femtosecond laser and bundled d-micro system, with guaranteed pulse duration below 10 fs at the sample plane.
Measurement examples
MULTI-FLUOROPHORE EXCITATION
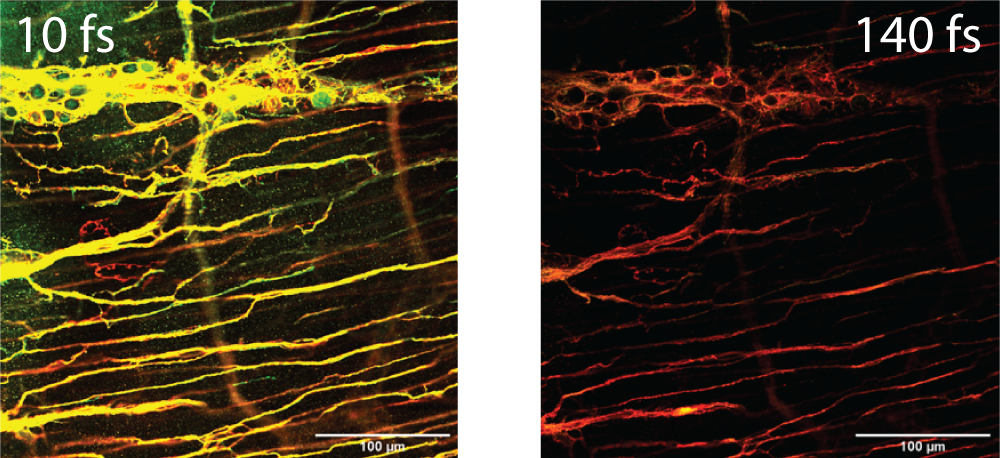
At the same average power level in the sample plane, the fluorescence intensity produced by compressed broadband pulses was 2 – 3 times brighter than for long-pulse Ti:Sa pulses. When normalised against GFP intensity, compressed broad- spectrum pulses generated 10% more signal in the blue and red channels compared to uncompressed Ti:Sa laser pulses at 810 nm. These data support the superior imaging capabilities of compressed few-cycle laser pulses in 2p microscopy of biological samples.
For more details please check:
A. Manickavasagam, P. Fendel, M. Miranda,
P. T. Guerreiro, H Crespo, M. Renshaw, K. I. Anderson, “Multiphoton Excitation Of Biological Samples With Fourier- Limited, Broad-Spectrum, Ultrashort Laser Pulses “, Focus On Microscopy Congress 2019.
Credits: Kurt Anderson, Francis Crick Institute / Thorlabs / Sphere
SyncRGB:FLIM
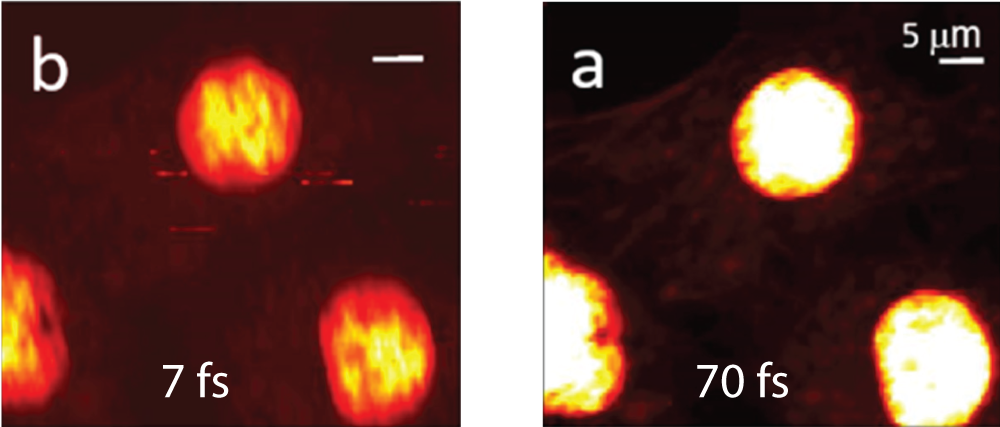
SyncRGB imaging using a 7 fs source. Multi-photon intensity images of the same sample areas taken with the compressed 70 fs Ti:Sapphire laser (a) and with the broadband 7 fs laser source (b). For both lasers, a filter configurations was chosen, a 685 nm short pass filter that transmits the emission wavelength ranges of all three chromophores. Scale bar in (a) is 5 μm and is used for all images and a pixel dwell time of 20 ms for all images. (a-b) are 100 × 100 pixels = 200 s/scan while (c-d) are 32 × 32 pixels = 20.5 s/scan.
For more details please check:
C. Maibohm, F. Silva, E. Figueiras, P. T. Guerreiro, M. Brito, R. Romero, H. Crespo, and J. B. Nieder, “SyncRGB-FLIM: synchronous fluorescence imaging of red, green and blue dyes enabled by ultra-broadband few-cycle laser excitation and fluorescence lifetime detection,” Biomed. Opt. Express 10, 1891-1904 (2019).
https://www.osapublishing.org/boe/abstract.cfm?uri=boe-10-4-1891
Brochures
Please feel free to download our brochures
Tips
From the d-scan trace you can get a lot of informations regarding the spectral phase of your ultrashort pulse
A tilt in the trace tells you that the ratio GVD/TOD is not good, the residual TOD is to high
Spectral modulations are usually caused by misaligned chirped mirrors
Whiskers are the sign that compression is diverging somewhere
Which product for which laser system?
Sphere Ultrafast Photonics products are suited for any application that requires femtosecond temporal duration measurement and optimization of the spectral phase at a given plane in order to get the shortest pulse on target
Few-cycle pulses
The d-scan and d-cycle are the products suited for this application.
Thanks to our technology we can measure and compress the most demanding ultrashort pulses. In 2018 we established the World Record for the shortest pulse ever achieved (and measured!), with 2.2 fs at the output of a single-channel hollow-core fiber compressor. How many companies do you know that produce devices that can handle such broad spectra and short pulses? I give you the answer: there are no other companies in the market that can do it! Our technology, experience and know-how allow us to adapt our system to the most challenging dispersion ranges and broad spectra, going from 450nm to 1.7um, as nobody else can.
Please have a look at these papers to see how far you can get with your hollow-core fiber setup
Strategies for achieving intense single-cycle pulses with in-line post-compression setups
F. Silva, B. Alonso, W. Holgado, R. Romero, J. San Roman, E. Conejero Jarque, H. Koop, V. Pervak, H. Crespo, and I. J. Sola
Vol. 43, No. 2 / January 15 2018 / Optics Letters
https://www.osapublishing.org/ol/abstract.cfm?uri=ol-43-2-337
All-optical measurement of the complete waveform of octave-spanning ultrashort light pulses
M. Miranda, F. Silva, L. Neoricic, C. Guo, V. Pervak, M. Canhota, A. S. Silva, I. J. Sola, R. Romero, P. T. Guerreiro, A. L’Huillier, C. L. Arnold And H. Crespo
Vol. 44, No. 2 / 15 January 2019 / Optics Letters
https://www.osapublishing.org/ol/abstract.cfm?uri=ol-44-2-191
Ultrafast Oscillators and Amplifiers, OPCPA, OPA
The d-scan, d-shot and d-cycle are the products suited for this application.
Our products are quite versatile and can be adapted to many different needs.
If you want to investigate how the spectral phase changes from one pulse to another, you might want to use a d-shot.
If you want to check your pulse duration at several planes in your laser chain and be able to compress it at the chosen plane, then you might go for a d-scan, which has a moving measuring head.
If you need a fixed diagnostic to check regularly your laser always in the same conditions, you might want to use a d-cycle.
If your needs are different from the one above, please feel free to contact us, we will be happy to help you out.
High peak power lasers
The d-shot is the product suited for this application.
High Power Lasers usually have a low repetition rate, that can go down to 1 shot every several minutes. In this case a single shot device is required, with the possibility to be triggered by an external signal. Our single shot system, the d-shot, is particularly suited for this application, covering the temporal duration range from 10 fs to 50 fs, which is typical for these kind of laser systems. Moreover, shot-by-shot changes in the spectrum or spectral phase can be easily detected.
To let you feel reassured, state of the art laser facilities like ELI pillars, APOLLON, Berkeley NL and others, have already installed our systems and are using them on a daily base, giving us a great feedback.
CEP-tag
The CEP-tag system provides measurement of the Carrier Envelope Phase (CEP) offset of amplified laser pulses at single-shot. It is based upon traditional f-2f interferometry, where the second harmonic of the red edge of an octave-spanning spectrum is spectrally interfered with the blue edge. Detection is based on a photodiode array and the use of Field-Programmable Gate Array (FPGA) electronics enables us to determine the CEP at a rate of 100 kHz.